District-level MXD Travel Model
What does it do?
The site-level travel model allows users to estimate transportation outcomes of development scenarios. When users "paint" development types using Envision Tomorrow, they are changing the mix and types of housing and jobs within a district. These changes impact travel behavior. The model is sensitive to changes in a variety of variables, commonly referred to as the "D" variables. These variables include Density, Design, Destinations, Demographics and Diversity of land uses.
How does it work?

The model applies trip modifications to standard single-use trip generation estimates developed by the Institute of Transportation Engineers (ITE). Mixed-Use Districts (MXDs) with diverse internal activities have been shown to capture internal trips at a rate higher than conventional suburban developments; therefore, the MXD Trip Generation model accounts for the internal capture of MXD sites by reducing the external trips produced and estimating the number of walking and transit trips that would typically be conducted by automobile. In addition, MXDs located in central areas have been shown to generate shorter vehicle trips, which has been accounted for in the model as internal and external vehicle miles traveled (VMT) are estimated based on published travel characteristics of MXDs.
The model is based on original research completed by Dr. Reid Ewing of the Center for Metropolitan Studies at the University of Utah. The model was estimated using observed travel behavior in 6 "mixed-use districts" around the country. Therefore, the model is appropriate when planning for an area no larger than a square mile and that will include a mix of land uses and urban street connectivity.
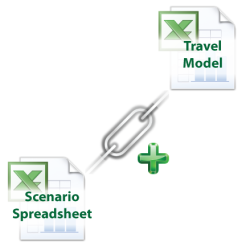
The model is a stand-alone spreadsheet that links to the Scenario Spreadsheet via a push-button macro. The scenario inputs are read in and linked automatically, that way if changes are made a simple Excel connection refresh will update the transportation related indicators.
Required Inputs at Site-level
The model requires the user to gather or calculate several inputs related to the planning site or district. Most can be derived with simple GIS analyses, including buffers etc. The three regional employment access variables can be more challenging to obtain, however, these are standard inputs into regional transport models so MPOs and other governments who run transportation models have this information in their "travel skim" tables.
- Regional employment count (based on a reasonable commute shed)
- Number fo intersections in the district
- Number of 4-way intersections
- Intersections within a 1-mile buffer of the study area boundary
- Transit stops within the district
- Proportion of the district boundary covered by a quarter mile buffer around the transit stops
- The area of both a quarter and 1-mile buffer around the studay area (sq mi)
- Assumed average vehicle travel speed within district
- Employment within 1 mile of the district boundary
- Employment within 20 and 30 minutes by auto
- Employment within 30 minutes by transit

