
Balanced Housing Model
WHAT DOES IT DO?
The Balanced Housing Model is used to analyze a community’s existing housing supply, including the matches and mismatches by age, household income and tenure (rental or owner-occupied). It is also used to conduct a capacity analysis of development potential and a forecast of future age and income cohorts. Using this information, the model can be used to create a series of policy and strategic recommendations for a balanced, sustainable future housing supply along with targeted goals that can be used to determine a community’s future progress in implementing its plan. The Balanced Housing Model has its origins in Oregon’s Statewide Goal 10 Housing Needs Analysis and the Portland Metro Region. Since its inception, it has been used in cities and regions across the country, most notably, Chicago where it is now the accepted standard for housing needs studies.
CHANGING CONSUMER PREFERENCES NATION-WIDE
Consumer preferences are changing across the country. Separate findings by Dr. Arthur C. Nelson at the University of Utah and Robert Charles Lesser Co. (RCLCO) found that demand has been in and will continue to shift away from large lot single family homes toward smaller, more compact housing stock. This means that there is a likely mismatch between what we have been building and what we will need to build in order to meet future demand.


Model Overview
The model includes 13 color coded spreadsheet tabs, in addition to an initial Quick Start Guide tab that explains the layout of the model and outlines the required data gathering from US Census American Community Survey (ACS) and local population and household forecasts. Pink tabs are initial input tabs. These tabs include:
- Initial Inputs
- Current Summary
- Current Rental
- Current Owner
- Current Age Income
- Future Age Income
- Future Cohorts
Red tabs are optional input tabs. Light Blue tabs are reference tabs providing some detailed information regarding projections. Dark Blue tabs denote outputs of the model. They include:
- Projection Summary
- Future Preferences
- Tapestry Summary
Individual cells are similarly color coded. Pink cells are input cells. Blue cells are for headings (dark) and subheadings (light). Output cells are white and information cells have a diamond symbol. As you work through each spreadsheet a red dot located in the heading for each sheet will turn green when all required fields are added. Many tabs include automatically generated charts to visualize the inputs and outputs of the model. These provide helpful snapshots of the current housing supply and future balanced housing needs.
Data Requirements
In order to estimate a community’s future housing needs, the model requires local forecast data, specifically:
- Projected Future Population
- Projected Future Households
The tool leverages current demographic data available through the American Community Survey (ACS) provided by the US Census:
- B01001. Sex by Age
- B26001. Group Quarters
- B25002. Occupancy Status
- B25118. Tenure by Household Income in the Past 12 Months
- B25070. Gross Rent as a Percentage of Household Income in the Past 12 Months - Universe: Renter-Occupied Housing Units
- B25063. Gross Rent - Universe: Renter-Occupied Housing Units
- B25091. Mortgage Status by Selected Monthly Owner Costs as a Percentage of Household Income in the Past 12 Months - Universe: Owner-Occupied Housing Units
- B25087. Mortgage Status and Selected Monthly Owner Costs - Universe: Owner-Occupied Housing Units
- B19037. Age of Householder by Household Income in the Past 12 Months (in Inflation-Adjusted Dollars) - Universe: Households
- B25007. Tenure by Age of Householder - Universe: Occupied Housing Units
- B25119. Median Household Income in the Past 12 Months (In Inflation-Adjusted Dollars) By Tenure - Universe: Occupied Housing Units
- B25032. Tenure by Units in Structure - Universe: Occupied Housing Units
In addition to the above required data, the model is equipped to process optional data inputs when available:
- B25077. Median Value (Dollars) - Universe: Owner Occupied Housing Units
- Future Projected Households and Population by Age Cohort
- ESRI Tapestry Data (2014 or later)
Input Tabs
Input tabs allow the user to supply relevant demographic data where prompted in order to build the profile of the current housing market and therefore make projections for future demand. Each table is labeled specifically and the format matches the ACS tables downloadable from the US Census.
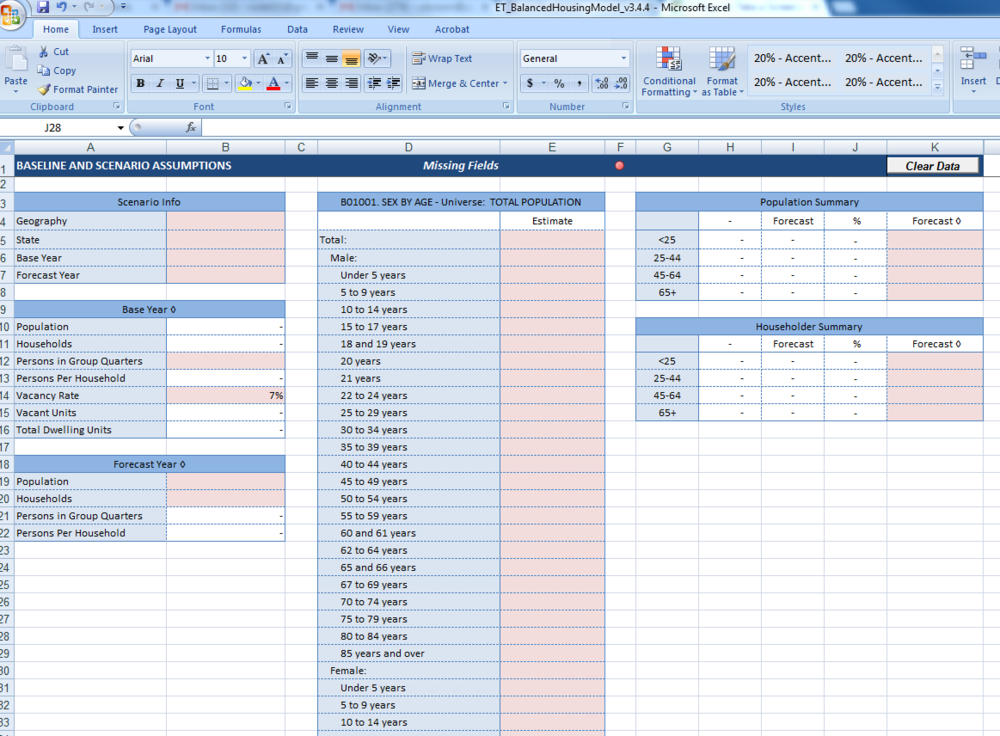
Initial Inputs
The Initial Inputs tab identifies the model’s geography, base year, and forecast year and includes the basic population and household counts for both years. It also includes ACS Table B01001 (Sex by Age) and has optional data inputs for more detailed population and household forecasts by age.
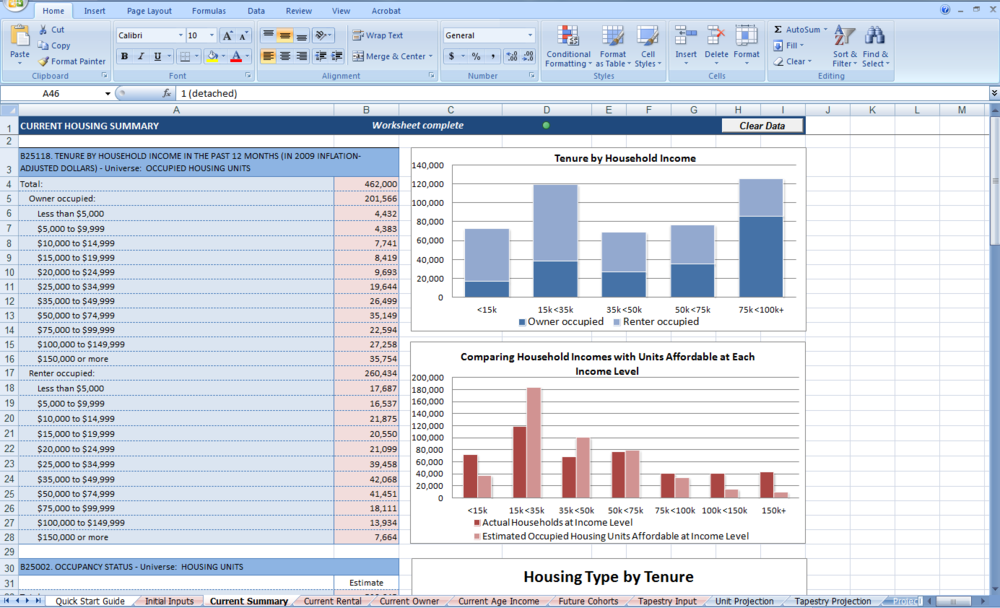
Current Summary
Using demographic data on occupancy status and tenure by income and by units in structure, the Balanced Housing Model creates helpful bar charts illustrating the current housing supply. Specifically, the model provides the number of owners and renters within major income breakdowns across the population and within the different types of housing available in the market, including single family homes, townhomes, multifamily, and mobile homes.
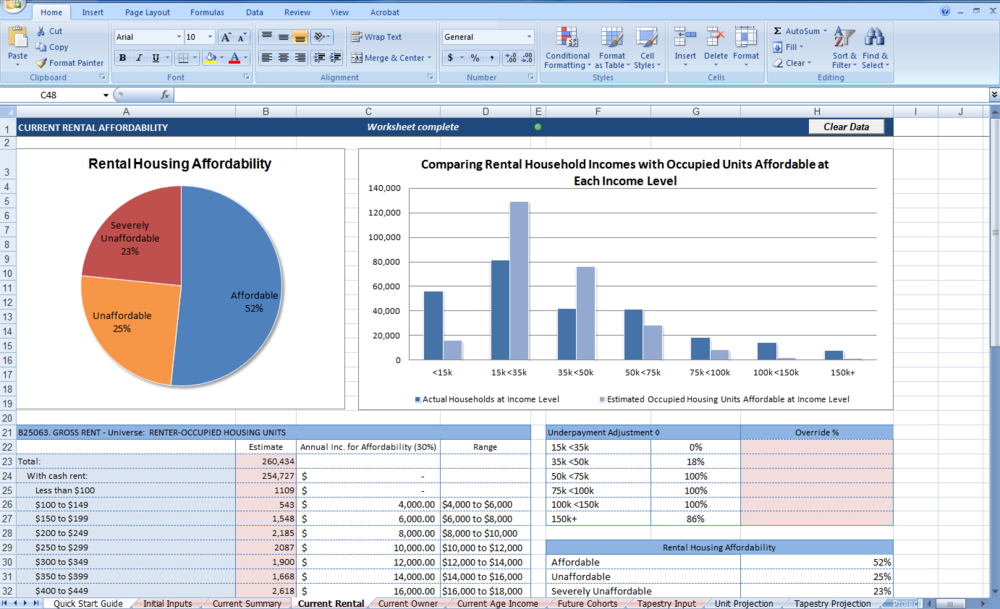
Current Rental
The model then takes in ACS gross rent figures to calculate housing affordability for renters within the geography and for individual income brackets within the population. Affordable rental housing is defined as a household paying less than 30% of their income in rent. The percentage of unaffordable housing reflects households spending 30%-50% of their income in rent. Severely Unaffordable represents the percentage of households paying over 50% of their income in rent. Comparing the number of available units and affordable units within each income segment offers a glimpse at where within the market tenants are under or over spending on housing based on limits to supply.
Current Owner
Similar calculations are done for owner occupied housing units, both with and without a mortgage.

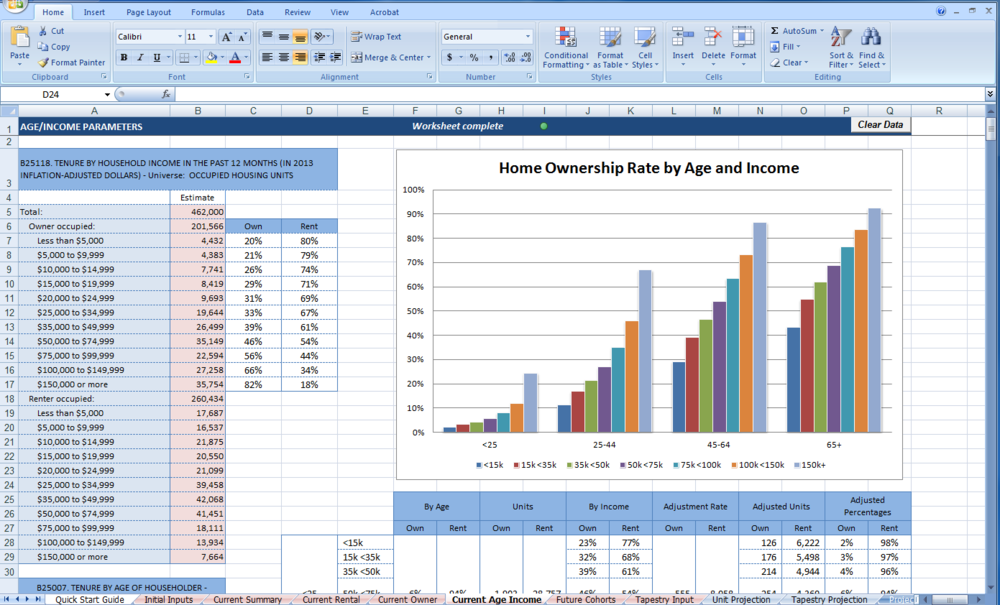
Current Age and Income
This tab uses both on the number of owners within specified age and income brackets to give a profile of current housing ownership rates.
Future Cohorts
This tab utilizes demographic data on the age of householders broken down by household income in conjunction with estimates for both owner and rental vacancy rates, the annual replacement rate for housing in the geography, and national tenure projections to inform the model’s future housing projections.

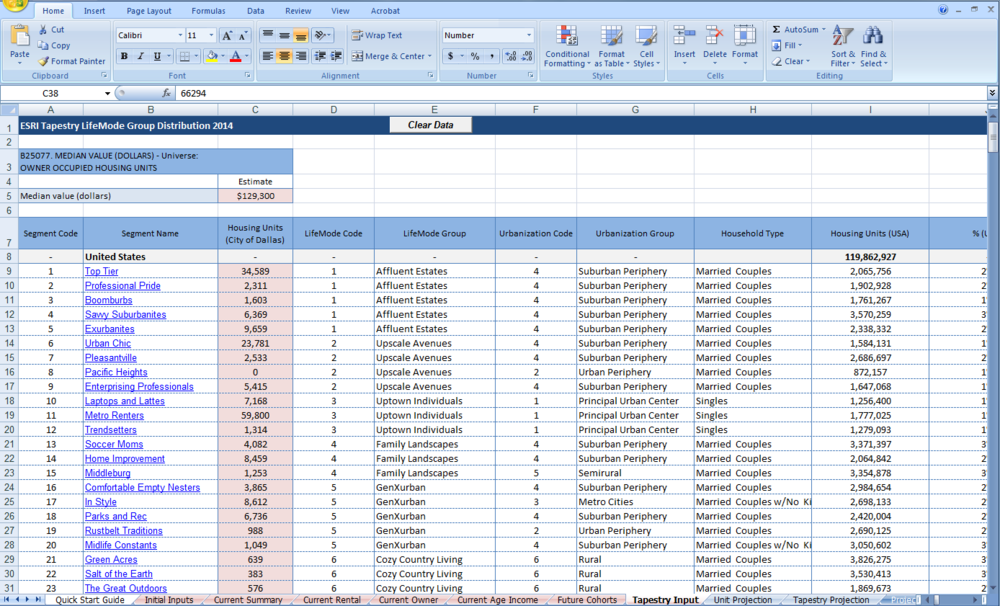
Tapestry Input (Optional)
This tab is an optional input tab. ESRI’s Tapestry segmentation combines demographic, consumer behavior, and geographic data to help identify, understand and target aspects of the current housing market. By defining every U.S. household in terms of 67 demographically and behaviorally distinct segments, it summarizes complex consumer profiles beyond traditional demographics. These market segments offer additional insight into housing preferences that goes beyond Census-based demographic data such as age and income. Data can be purchased through ESRI. It is available by state and is provided at the census tract level.
Reference Tabs
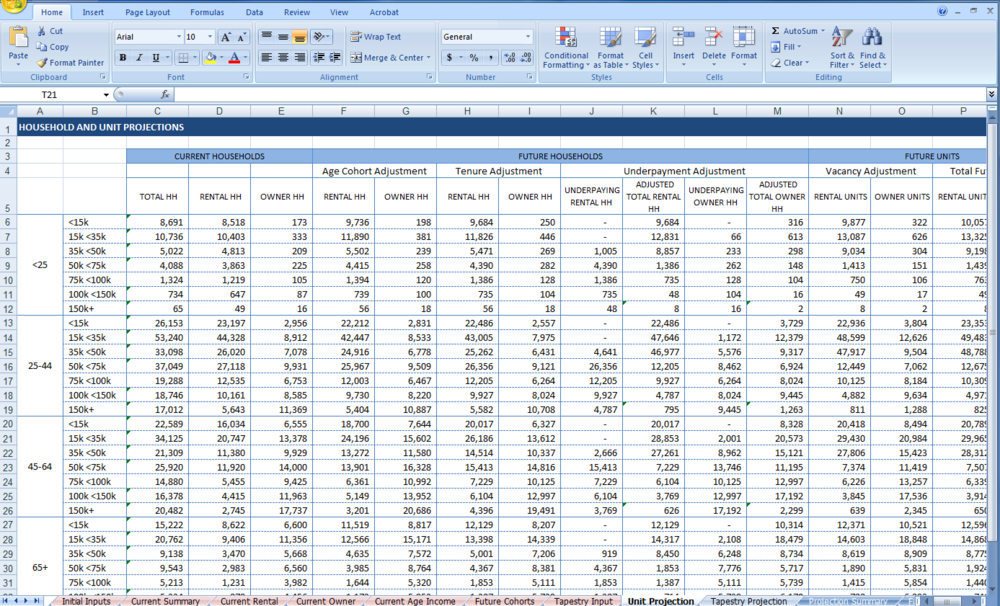
Unit Projection
The 'Unit Projection' tab uses the household forecast entered in the 'Initial Inputs' tab to disaggregate and project future household demographics in fine-grain detail. The current and future household projection table applies assumptions from the 'Future Cohorts' tab to project future households by age, tenure, and income.
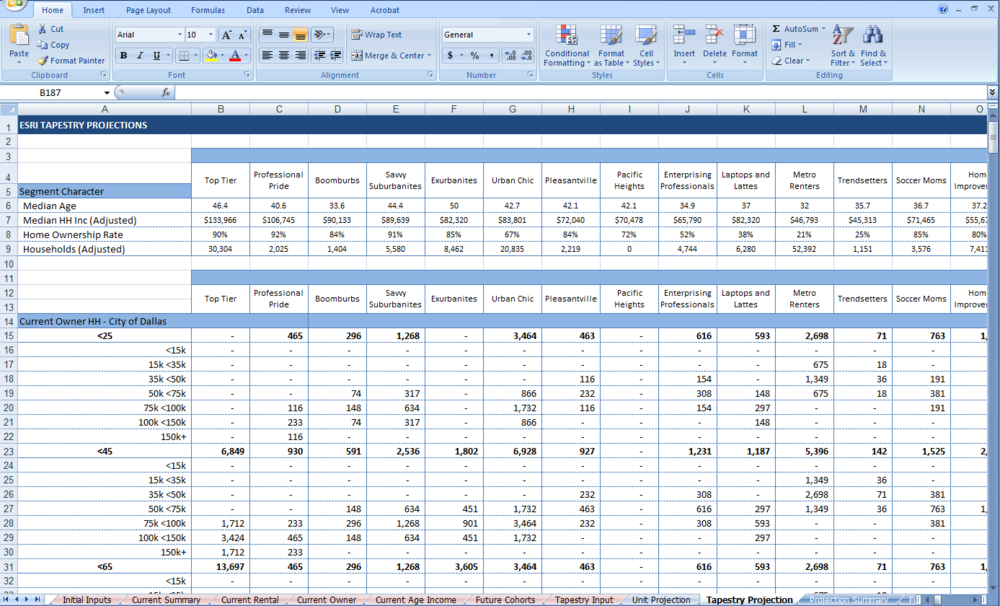
Tapestry Projection (Optional)
The 'Tapestry Projection' tab uses the outputs of the 'Unit Projection' tab and applies key demographic variables from the 'Tapestry Input' tab to make estimates of the future tapestry composition in your study area. Based on what the 'Unit Projection' tab tells us about householder age, income, and tenure, we can make assumptions about the future tapestry segments which match those demographic datapoints.
Output Tabs
Output tabs supply tables and charts reflecting the results of the Balanced Housing Model and are broken into three tabs.
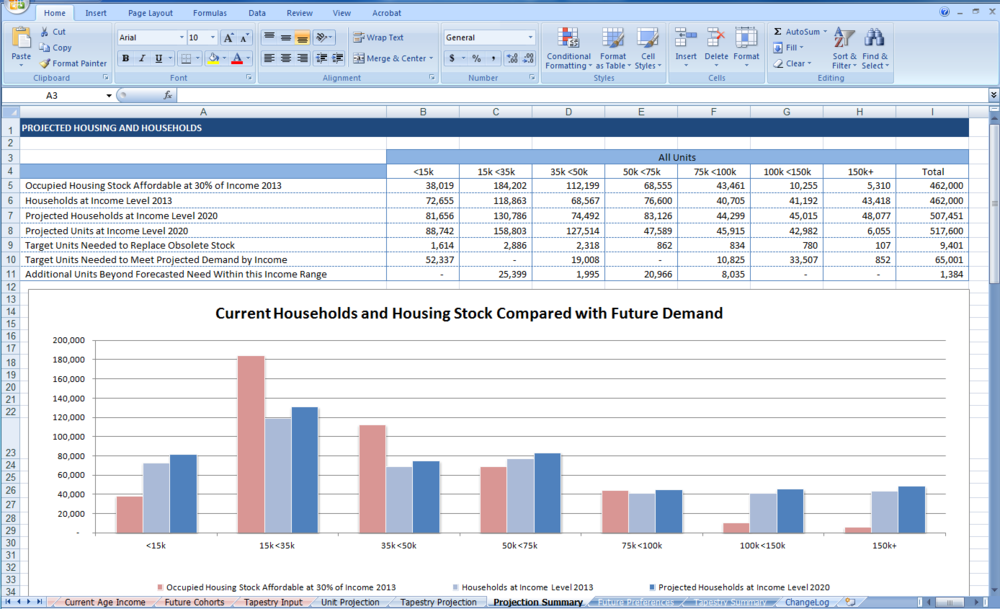
Projection Summary
This is the first tab with future housing targets. It compares the current number of households within each income bracket and the number of units affordable within those brackets to future demand by income. It then breaks that analysis down by rental and by owner occupied housing.
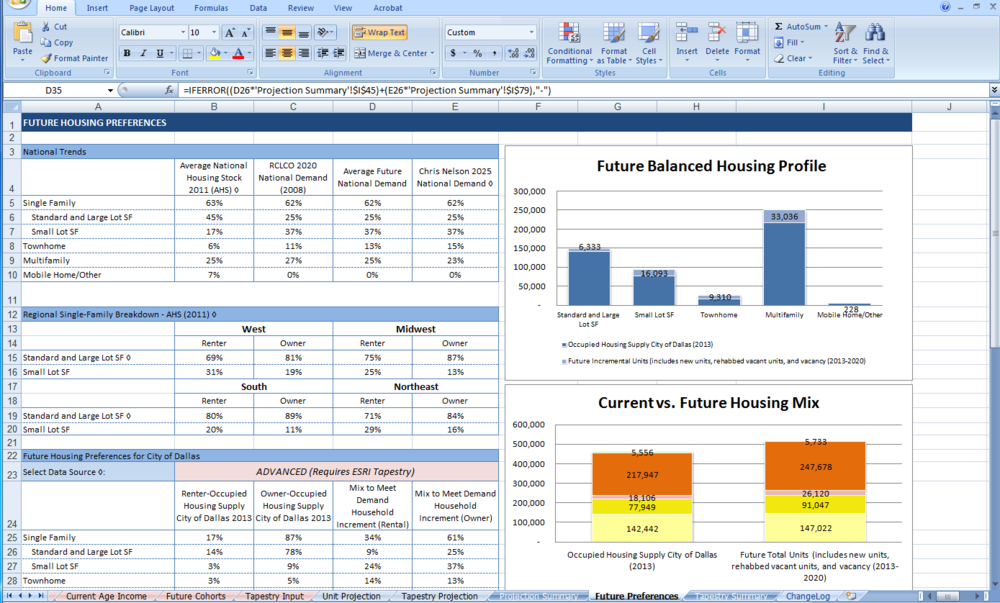
Future Preferences
This tab uses the demographic and forecast data supplied earlier in the model to generate a Future Balanced Housing Profile that indicates the number of units recommended within the different housing types in order to provide a balanced and sustainable housing supply. The incremental units can then easily be broken down into annual estimates in order to track progress during implementation. The model offers both preferences based solely on standard demographics or by applying tapestry segment preferences. The model allows you to toggle between the two data sources for comparison.
The model’s standard demographic projections incorporate assumptions based upon RCLCO national demand trends and Chris Nelson’s national demand model. RCLCO (Robert Charles Lesser & Co) provides real estate industry trends and strategies. Chris Nelson looks at generational changes in housing demographics nationally.
Tapestry Summary
This tab offers a snapshot of the Top 10 Tapestry segments in the region at the base year and how those top segments may change for the projected year. Given that Tapestry segments include more detailed consumer preferences, these figures can be used to anticipate future trends in housing type and location.
