
Analyzing Scenarios
Envision Tomorrow is an iterative scenario planning tool. This means that you can check the outputs of your scenarios in real time, as they are being built, and at the end when you are comparing them to one another. There are two primary ways to view the results Envision Tomorrow. First, they can be viewed within the Scenario Builder spreadsheet in a number of ways that will be discussed below. Second, they can be written back to the scenario featureclass and visualized spatially across parcels or scenario polygons.
Scenario Spreadsheet
The scenario spreadsheet offers several ways to break down and view results. The relevant tabs are:
- Summary New
- Summary Total
- Scenario Tabs
- Buildings Tabs
Summary New
The "Summary New" tab displays indicators related to only the "new" development in your scenario. This can be referred to as "gross new" or just "new." Because this tab does not quantify redevelopment, it is not displaying incremental or "net new" metrics related to new development. Rather it is showing the impact of just new construction.
This tab contains over 100 separate indicators that can be compared across up to five scenarios. Since only new development is being quantified, these indicators cannot be compared to "existing conditions." For a more thorough discussion of Envision Tomorrow indicators, see the indicators section.
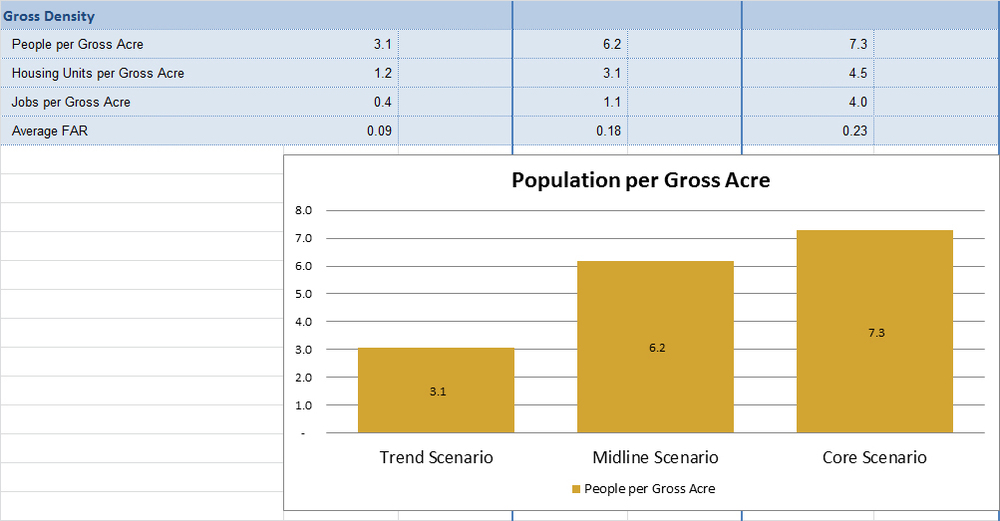
Summary Total
The "Summary Total" tab displays two kinds of indicators. Most of the 100+ indicator tables and graphs are related to "total future" impacts. That is, metrics associated with the full build-out of your scenario. This is quantified as follows: [existing development] - [redeveloped existing development] + [new development].
The second and less common variety of indicator contained within this tab are "net new" indicators. These reflect only the true increment of development and are quantified as follows: [new development]-[redeveloped existing development].
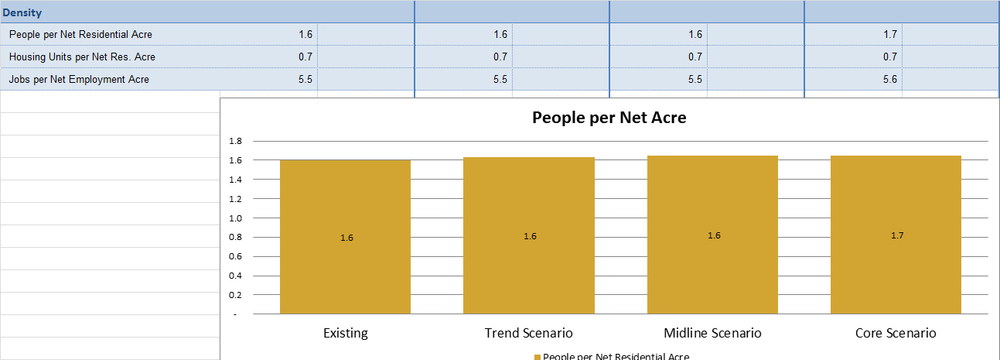
Note: If you only want your indicator graphs to show results from certain scenarios (say you only have two of the five slots populated), simply hide the columns corresponding to scenarios you wish to remove from your graphs. The graphs will update automatically and hide the undesirable information.
Scenario Tabs
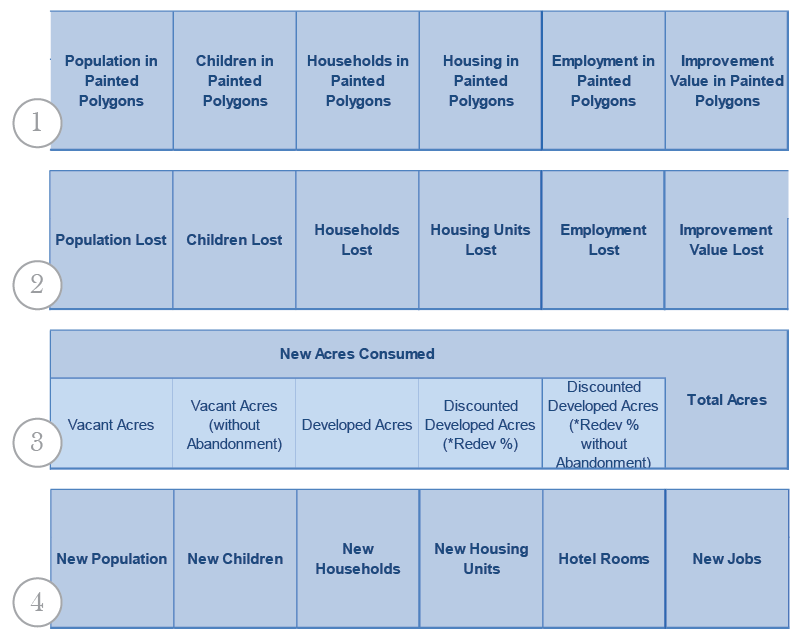
The Envision Tomorrow Scenario Builder spreadsheet contains five "Scenario" tabs. Each is labeled with a number, 1-5, corresponding to the scenario "slot" being used in the Envision Tomorrow paint tool. These tabs show both the redeveloped and painted values for key metrics (value, population, housing units, employment) but also the number of vacant and developed acres and the amount of new development in the scenario.
There are four main sections to each scenario tab. The first relates to the amount of development in "painted polygons." That is, how much population, employment, or other development is contained within the cells or parcels painted in the scenario. This does not take redevelopment rate or abandonment rate into acount.
The second section of the scenario tab relates to redevelopment. It applies the redevelopment rate and abandonment rate to the first section to quantify the "redeveloped" values for key metrics such as population, employment, housing units, and real estate value.
The third section tracks vacant and developed acres painted in the scenario. This is where Envision Tomorrow actually writes values which flow through the rest of the spreadsheet. Vacant and Developed acres are summed by development type and written in the VAC_ACRE and DEVD_ACRE columns on each scenario tab.
The fourth and final section uses the the vacant and developed acre counts to calculate future new values for a range of scenario metrics. From population to stormwater runoff.
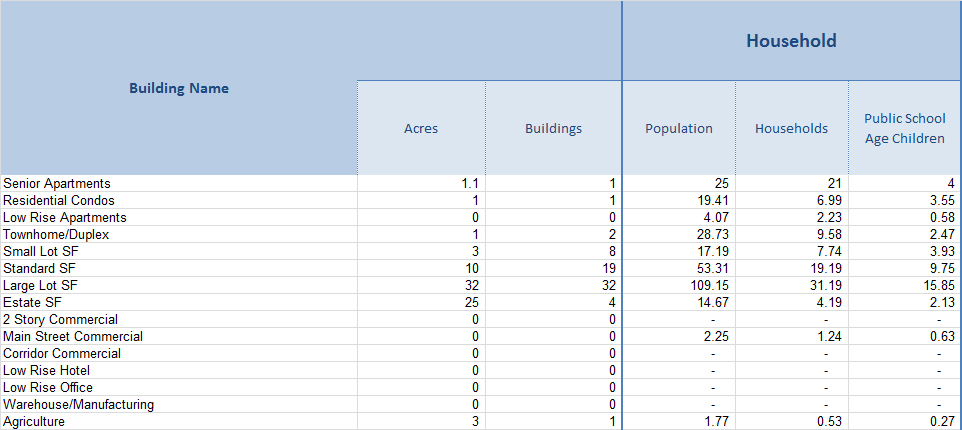
Bulidings Tabs
The Envision Tomorrow Scenario Builder spreadsheet contains five "Bulidings" tabs. Each is labeled with a number, 1-5, corresponding to the scenario "slot" being used in the Envision Tomorrow paint tool. Each of these tabs is similar to the "Scenario" tabs, but with a twist. Rather than breaking new development down by development type, it reports new development by building type.
Custom Reporting
Because the Envision Tomorrow Scenario Builder spreadsheet is built within Microsoft Excel, it provides users with the flexibility to create their own metrics from scenario outputs. Feel free to create new tables, graphs, tabs, and custom reporting to fit your needs.
Visualizing Results
The same results that exist in the scenario spreadsheet can be visualized spatially by writing them to your Envision Tomorrow scenario layer featureclass.
Attribute Field Manager
The Attribute Field Manager is a spatial tool in the Envision Tomorrow toolbar that allows users to select a range of development type attributes and then have the paint tool write them to their scenairo featureclass.
Select the ‘Attribute Field Manager’ function in the ‘File’ menu, and the field manager window pops up. There you will see dozens of ‘attribute fields’ that ET can track and write in the scenario layer.
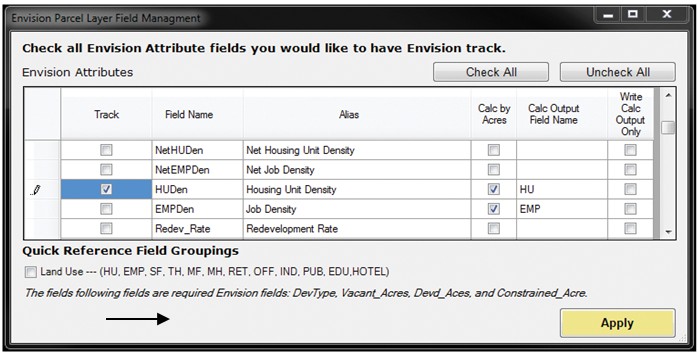
Certain attributes can be multiplied against the land area (acres) and result in additional variables. For instance, housing unit density can be multiplied against the land area (acres) and result in housing units. This additional variable can be calculated by checking the ‘Calc by Acres’ box.
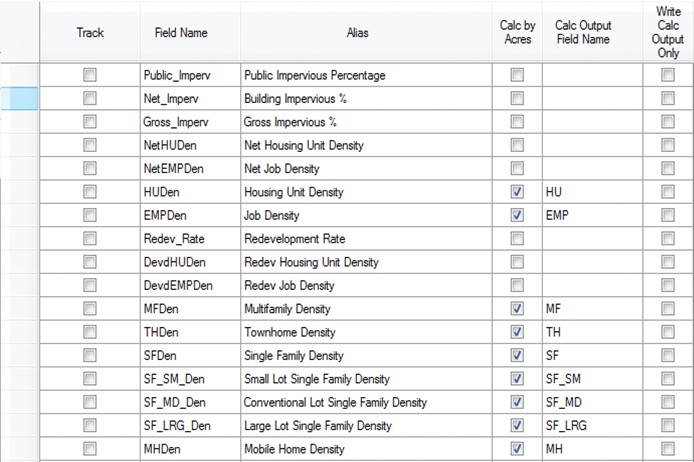
In order to add the desired field to the attribute table of your scenario layer you must check the 'Track’ box. For example, if you want to track the calculation outputs of housing density (‘HUDen’) and housing unit (‘HU’), you should check the ‘Track’ box on the left side of the ‘Field Name’ column.
When you click the ‘Apply’ button at the bottom of the window, ET automatically tracks the attribute field to your featureclass and displays a confirmation when done.
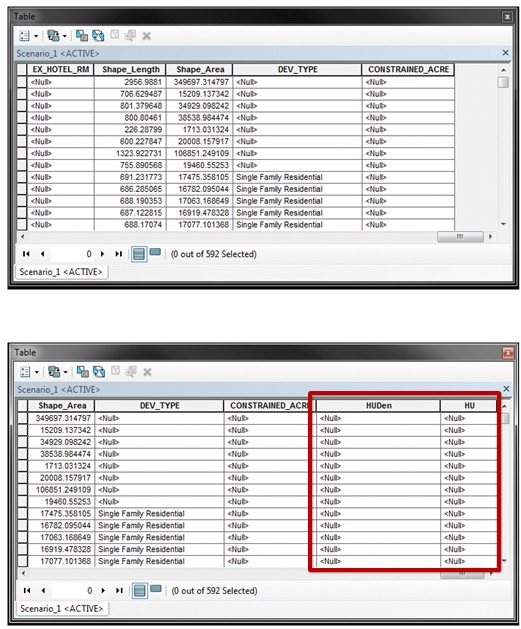
When you right-click your scenario layer in the ‘Table Of Contents’ window and select the ‘Open Attribute Table’ function, you will see the attribute table for that scenario layer. In the attribute table, you will also find that the desired fields have been added to the table, however with <null> or blank values for all features. In order to populate these newly added tracking fields, you must perform a 'quick sync' (for synchronizing only painted areas) or a 'full sync' (for all features).
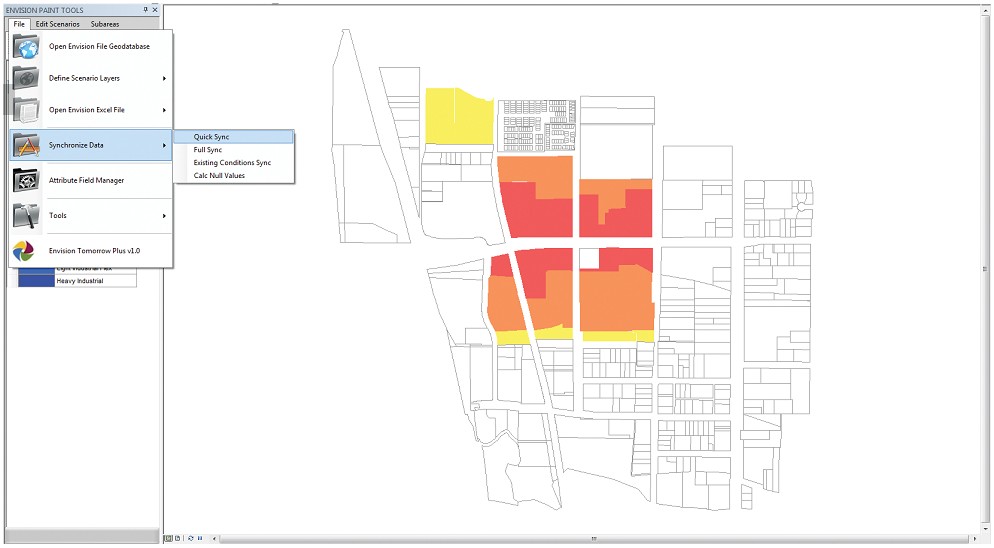
Note: If the numbers in your scenario featureclass are not in line with the "new" totals in your scenario spreadsheet, it is likely that your development type attributes have changed synce you last performed a 'development type attribute sync'. Make sure to perform a 'development type attribute sync' by browsing to the 'excel spreadsheet' menu in the ET toolbar.
The attribute field manager also provides a function that allows users to select reference field groupings based on land use categories easily. At the bottom of the Attribute Field Manager window, you can find the ‘Quick Reference Field Groupings’ section. When you click the checkbox, fields directly related to land use categories are automatically selected to produce output fields and add them to the attribute table of the scenario.
Analysis Tools
There are also a growing number of stand-alone analysis tool spreadsheets that interact with the Scenario Builder spreadsheet. These anlaysis tools are covered in greater detail in the analysis tools section. They include: